If you have just opened an MT4 backtest report for the first time, it looks like a wall of numbers with no obvious starting point. It isn’t. Roughly ten fields carry almost all the meaning, and once you know which ones they are, you can judge a Strategy Tester report in about a minute.
The Short Answer: What an MT4 Backtest Report Actually Tells You
A Strategy Tester report tells you how a strategy would have behaved on past data: how much it made, how deep it fell, how many trades it took, and how good the data behind the test was. However, it does not tell you what will happen next. Therefore, read it as a filter for ruling systems out, not as a forecast.
The Ten Fields That Matter on a Strategy Tester Report
Here is a full report with the ten fields worth checking marked on it.
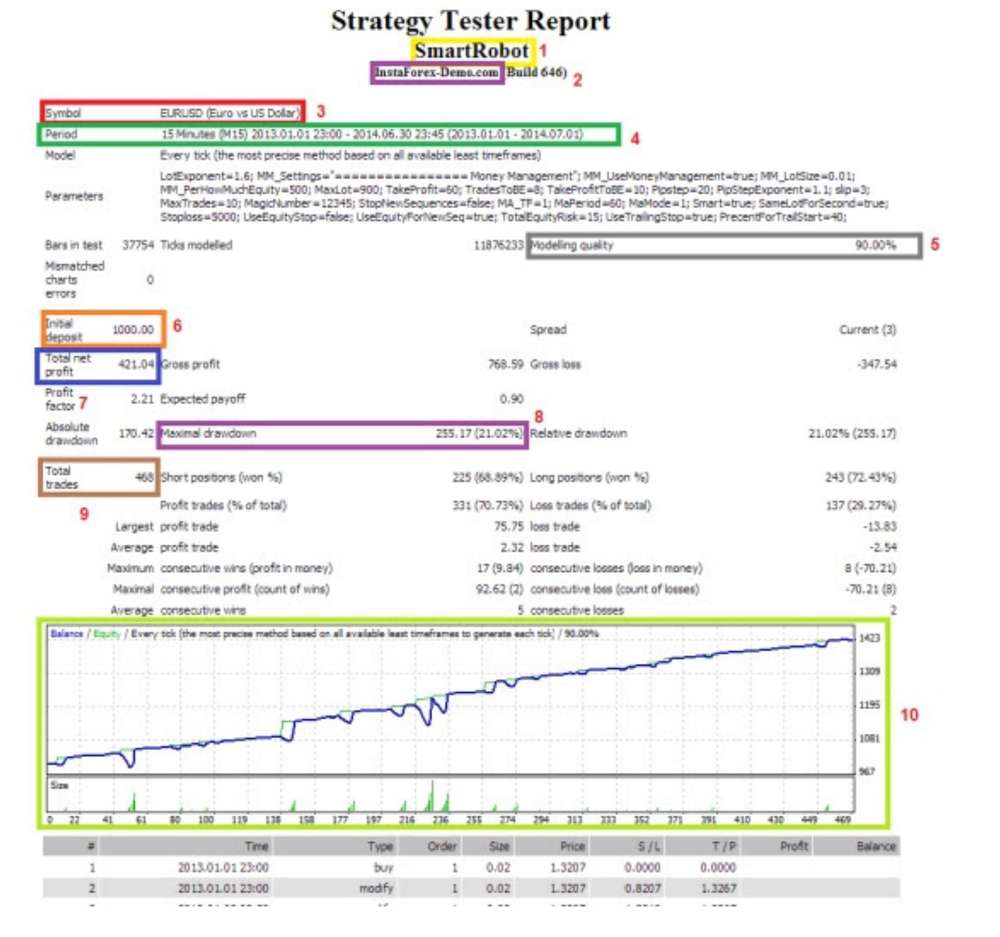
- Expert name — which EA produced the report. Check it matches the one you were sent.
- Broker and build — whose price history the test ran on, and which MT4 build. Different brokers give different results from the same EA.
- Symbol — the pair or asset tested. A report on one pair says nothing about the others.
- Period — the timeframe and the date range. This is the single most revealing line on the page.
- Modelling quality — how accurately MT4 reconstructed price movement inside each bar.
- Initial deposit — the starting balance every other figure is relative to.
- Profit factor — gross profit divided by gross loss.
- Maximal drawdown — the deepest peak-to-trough fall, in money and as a percentage.
- Total trades — the sample size behind every other statistic.
- The balance graph — the shape of the equity curve over the test.
The rest of this guide takes the ones that are most often misread.
Modelling Quality: Why 90% Is the Number to Look For
Modelling quality describes how well MT4 reconstructed what happened inside each bar. The tester only has historical bars, so it has to simulate the ticks between them, as MetaQuotes’ own documentation describes. The better the underlying one-minute data, the closer that simulation gets.
90% is the practical ceiling using broker data. Even with complete M1 history from your broker, 90.00% is what the tester reports. Anything higher requires imported third-party tick data, which is why you sometimes see 99% quoted. Below 90% means the M1 history had gaps, and the further below, the less the result means.
Two things to check alongside it. Mismatched chart errors should read 0; any other number means the history itself was inconsistent. And the Model line should say “Every tick” — the other modes are faster but far cruder.
One honest caveat: a high modelling quality says the data was clean. It says nothing about whether the strategy was curve-fitted to it. Those are separate questions, and we cover the second in how to know if an expert advisor backtest is reliable.
Profit Factor and Expected Payoff: The Two Numbers Sellers Skip
Profit factor is gross profit divided by gross loss. In the example report, 768.59 divided by 347.54 gives 2.21 — the strategy made $2.21 for every $1 it lost. In short, below 1.0 the system loses money. Between 1.0 and 1.3 the edge is thin enough that costs can erase it. Anything above about 3.0 on a short test is usually a sign of over-fitting rather than brilliance.
Expected payoff is the average result per trade: net profit divided by total trades. In the example, $421.04 across 468 trades gives $0.90. That number matters more than it looks, because it tells you how much room there is for costs. If your broker’s spread and commission come to more than the expected payoff, a profitable backtest becomes a losing live account.
Absolute, Maximal and Relative Drawdown: Three Numbers, One Report
The report gives you three drawdown figures and they are not interchangeable.
- Absolute drawdown — how far the balance fell below the starting deposit. In the example, $170.42.
- Maximal drawdown — the largest peak-to-trough fall anywhere in the test, in money. Here $255.17.
- Relative drawdown — the same fall expressed as a percentage of the peak. Here 21.02%.
Of the three, relative drawdown is the one to judge, because it scales to any account size. As a result, a seller quoting only the absolute figure is quoting the smallest of the three.
And remember which drawdown a backtest measures: closed-trade balance. If the EA holds losing positions open, the account can sit far deeper underwater than the report shows. That distinction, and how much drawdown is actually acceptable, is covered in how much drawdown is acceptable for an expert advisor.
Total Trades and Test Period: Sample Size Decides Everything
Above all, every percentage on the report rests on the trade count. The example shows 468 trades over 18 months, which is enough for the averages to mean something. By contrast, a report showing 30 trades over two months is not evidence; it is a small sample that happened to land well.
Next, check the Period line for what the test lived through. A range that covers only a trending market tells you how the EA handles trends and nothing else. The more market conditions inside the window, the more the numbers are worth.
Win Rate Alone Means Nothing — Check the Average Trade
This is where most people misread a report, and the example shows it clearly.
The strategy won 70.73% of its trades. At first glance that sounds excellent. But look at the two lines below: the average profit trade is $2.32 and the average loss trade is $2.54. In other words, the average loser is bigger than the average winner. The system is profitable only because it wins far more often than it loses.
That combination — high win rate, losses larger than wins — is worth understanding before you trust it, because it is what a system looks like when it holds losers longer than winners. Admittedly, it can work. It is also fragile in exactly the conditions a backtest is least likely to contain.
The other line to read here is maximum consecutive losses. The example shows 8 in a row. Whatever that number is, assume you will eventually see a longer streak live, and ask yourself whether you would still be running the EA at the end of it.
Reading the Balance Graph
The graph plots balance (blue) against equity (green) across the test. Two things to look for.
Where the two lines separate. A gap means that open positions were sitting at a loss. The wider and longer those gaps, the more floating risk the strategy carries between closed trades.
The shape of the recovery after each dip. Where the curve drops and climbs back steadily, the system is behaving. However, if each dip goes deeper and takes longer to recover, the edge is decaying. And a perfectly straight line is a cue to check the trade count and the test period again.
What an MT4 Backtest Report Cannot Tell You
Ultimately, a clean report is a starting filter, not a guarantee. Four things it will never show:
- Slippage and spread widening as they actually occur during news and at the open.
- Whether the strategy was optimised on this exact history and would fall apart on any other.
- Correlated risk across pairs, because MT4’s tester runs one symbol at a time.
- Your own behaviour during the drawdown that the graph makes look small.
Those questions are what judging a backtest’s reliability is for, and why so many technically sound systems still end up losing money — a pattern we go through in why most expert advisors fail.
Final Thoughts on Reading an MT4 Backtest Report
Reading an MT4 backtest report is a skill you learn once and use forever. Check the period and the trade count first, then modelling quality, then the drawdown figures, then the average trade. If a seller will not give you the full report — or gives you a cropped one — you already have your answer, and how to spot a scam Expert Advisor covers what else to look for.
If you would rather read a report from a system you can test yourself, our published multi-year results are there to be checked, and you can run the Free FX Robot on a demo account and generate your own report before risking anything.